
What's Inside
There's no shortage of numbers you could track. These are the ones that actually tell you whether your health center is on solid ground.
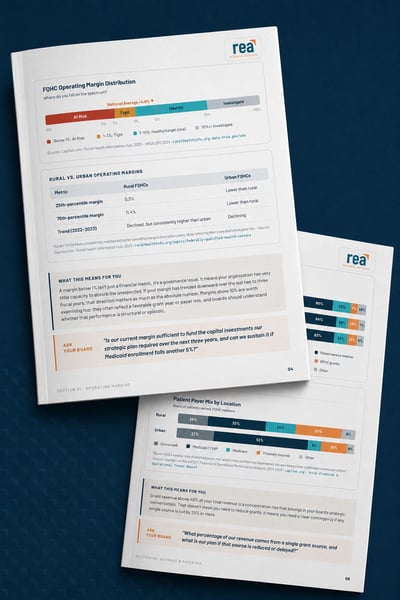
- Operating Margins — The national average sits at 4.8%, and about one in four health centers runs at or below breakeven. See where the real risk zones start, and how rural and urban centers compare.
- Revenue & Payer Mix — Grant revenue above 40% of total revenue is a concentration risk most boards haven't discussed yet. Understand how your payer mix stacks up and what it means for revenue stability.
- Costs & Staffing — Personnel eats up 68–70% of expenses at most FQHCs. Find the ratio where the math stops working — and what high-performing health centers do differently.
- Liquidity & Cash Reserves — The median health center holds 111–120 days cash on hand. See whether you're in the danger zone, the building zone, or ahead of the curve.
- Program Efficiency — Nationally, 88 cents of every dollar goes directly to patient care. Learn how to communicate that number with confidence in grant narratives and board reports.
Explore Rea's Audit & Advisory Services for FQHCs
FQHCs operate at the intersection of nonprofit governance, federal funding requirements, and healthcare regulation. Our FQHC practice is built on deep familiarity with the compliance obligations, funding structures, and reporting requirements specific to community health centers.
Our solutions include:
- Single Audit Expertise
- 340B Program Experience
- Medicare & Medicaid Cost Reporting
- Employee Benefit Plan Audits
- And More